Seeking Tax-Efficient Monthly Income?
NEOS ETFs aim to deliver the next evolution of options strategies, where seeking income is the outcome.
Explore our ETFs How to InvestAll NEOS ETFs Aim to Generate Tax-Efficient Monthly Income Across Core Portfolio Exposures
| Since Inception on 08/30/2022 to 3/31/2024 | Distribution Yield |
Total Return |
1 Yr Standard Deviation |
1 Yr Beta (vs SPX Index) |
|---|---|---|---|---|
| SPYI NEOS S&P 500® High Income ETF |
12.01% | 22.74% | 8.42% | 0.59 |
| CSHI NEOS Enhanced Income 1-3 Month T-Bill ETF |
6.03% | 9.20% | 0.16% | 0.00 |
| BNDI NEOS Enhanced Income Aggregate Bond ETF |
5.28% | 3.43% | 7.25% | 0.99 |
| S&P 500® Index (SPY ETF) |
1.25% | 33.61% | 13.60% | 1.00 |
| 1-3 Month Treasury Bills (BIL ETF) |
5.31% | 7.44% | 0.11% | 0.00 |
| U.S Aggregate Bond Index (AGG ETF) |
3.59% | 1.59% | 7.20% | 0.99 |
SPYI
NEOS S&P 500® High Income ETF
SPYI seeks to provide high monthly income in a tax efficient manner and the potential for compelling total returns using sold and purchased S&P 500® Index call options.
BNDI
NEOS Enhanced Income Aggregate Bond ETF
BNDI seeks to provide enhanced monthly income above what investors would receive from investing in ETFs with the same underlying core bond exposure, while maintaining a similar risk profile.
CSHI
NEOS Enhanced Income 1-3 Month T-Bill ETF
CSHI aims to provide an enhanced monthly income stream above what investors would receive from investing in 1-3 Month U.S. Treasury Bills, while maintaining a low risk profile.
For each NEOS ETF's regulatory documents, standardized performance, and additional information, please click on the corresponding ticker: SPYI | BNDI | CSHI
30-Day SEC Yield: SPYI = 0.78% | BNDI = 2.74% | CSHI = 4.88%
Past performance does not guarantee future results. The hypothetical scenarios are for illustrative purposes only. For standardized performance, please visit click here. Yield for NEOS ETFs is shown as Distribution Yield. Yield for SPY, AGG, & BIL is shown as Dividend Yield. The nature of the SPY, BIL, & AGG’s underlying exposure do not allow for a distribution yield for comparison. The chosen yields are the most closely related for comparative purposes.
Short term performance, in particular, is not a good indication of the fund’s future performance, and an investment should not be made solely on returns. Please see disclosures at the bottom of the page for a comparitive ETF discussion. Source: Morningstar, US Bank.
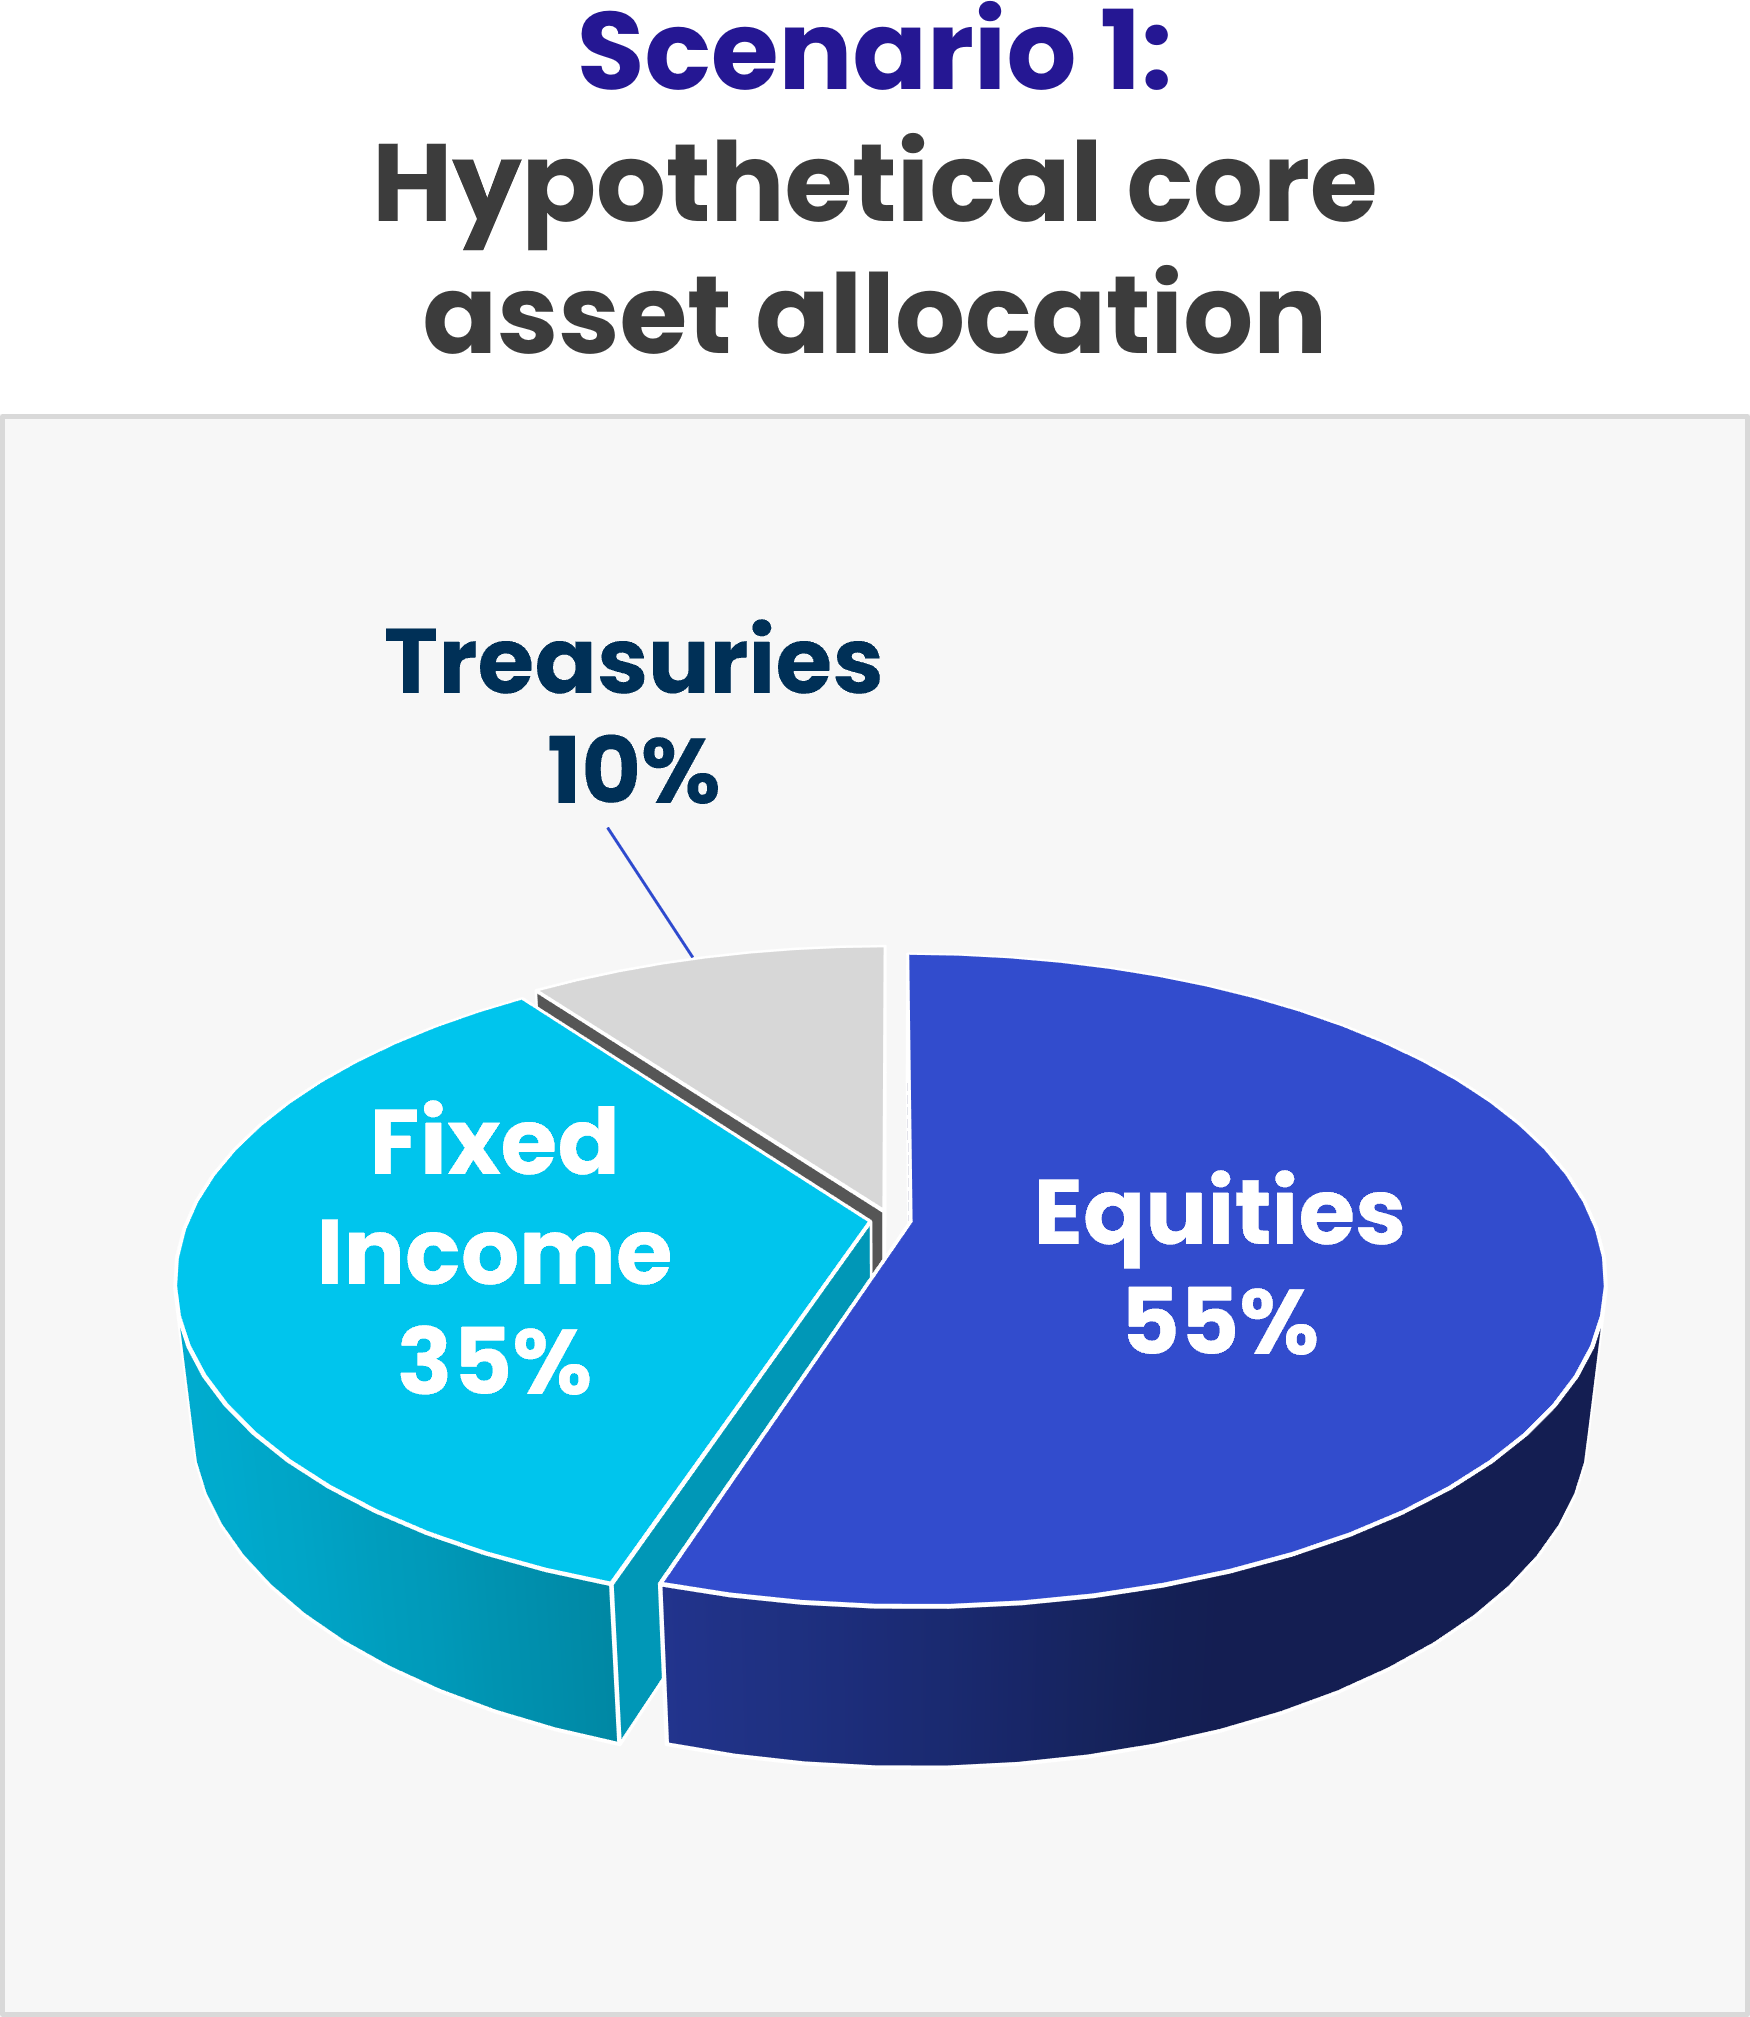
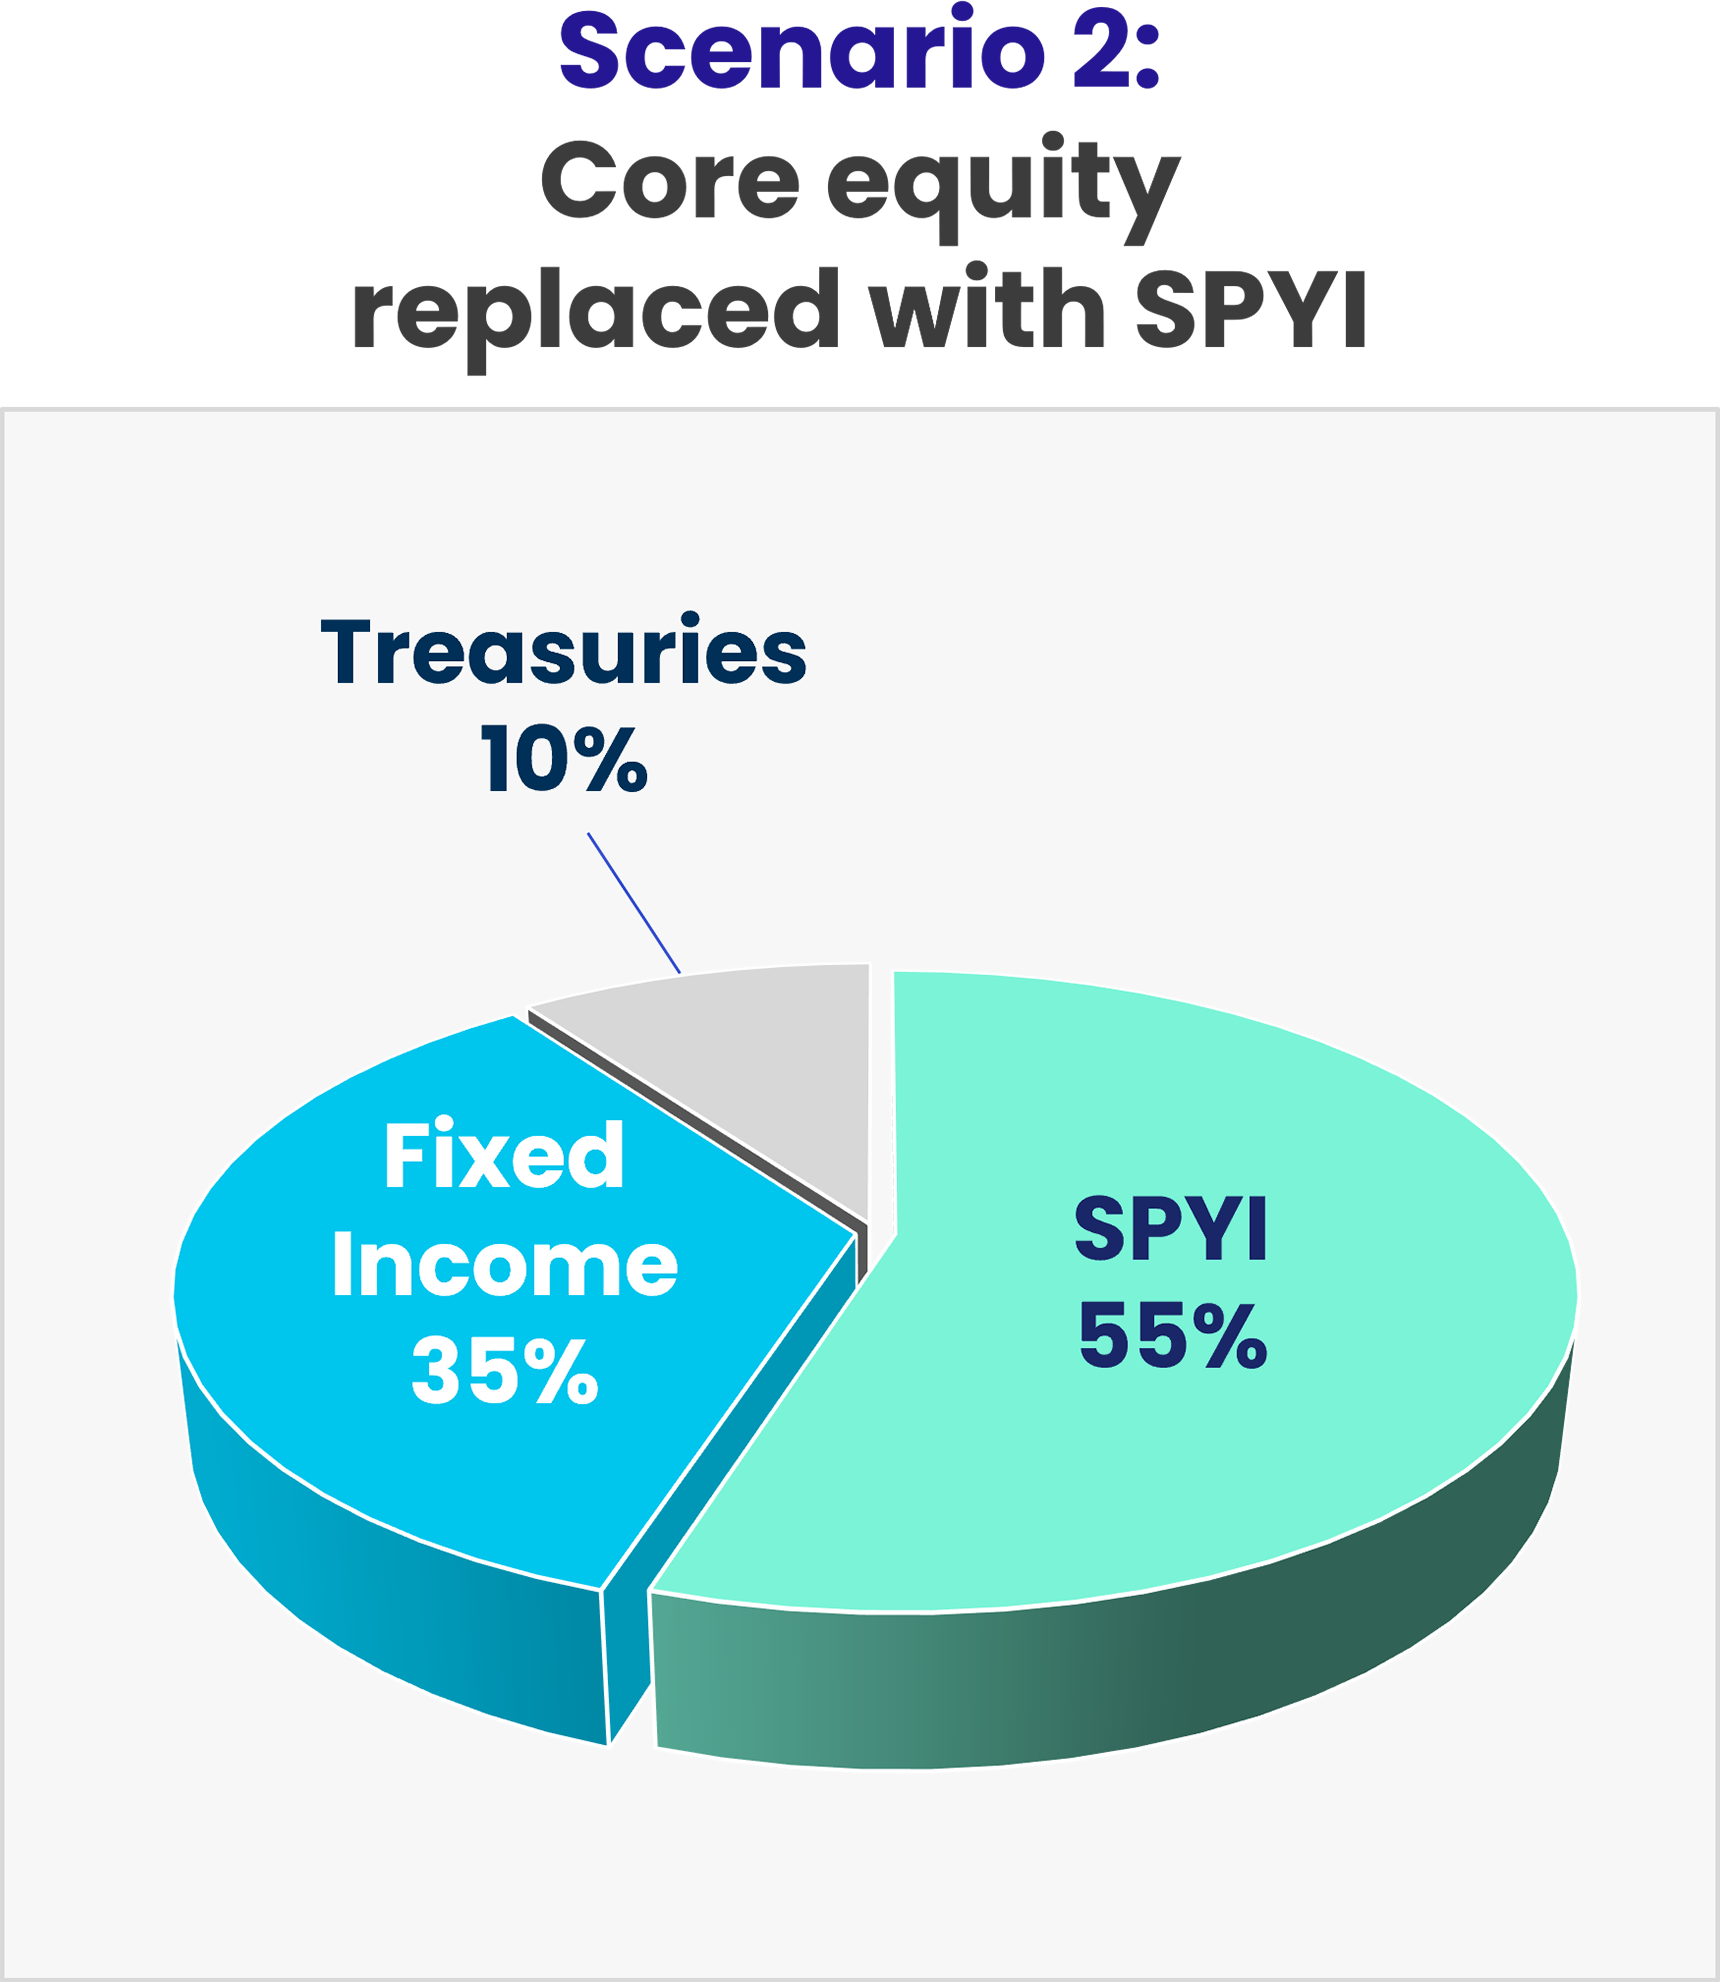
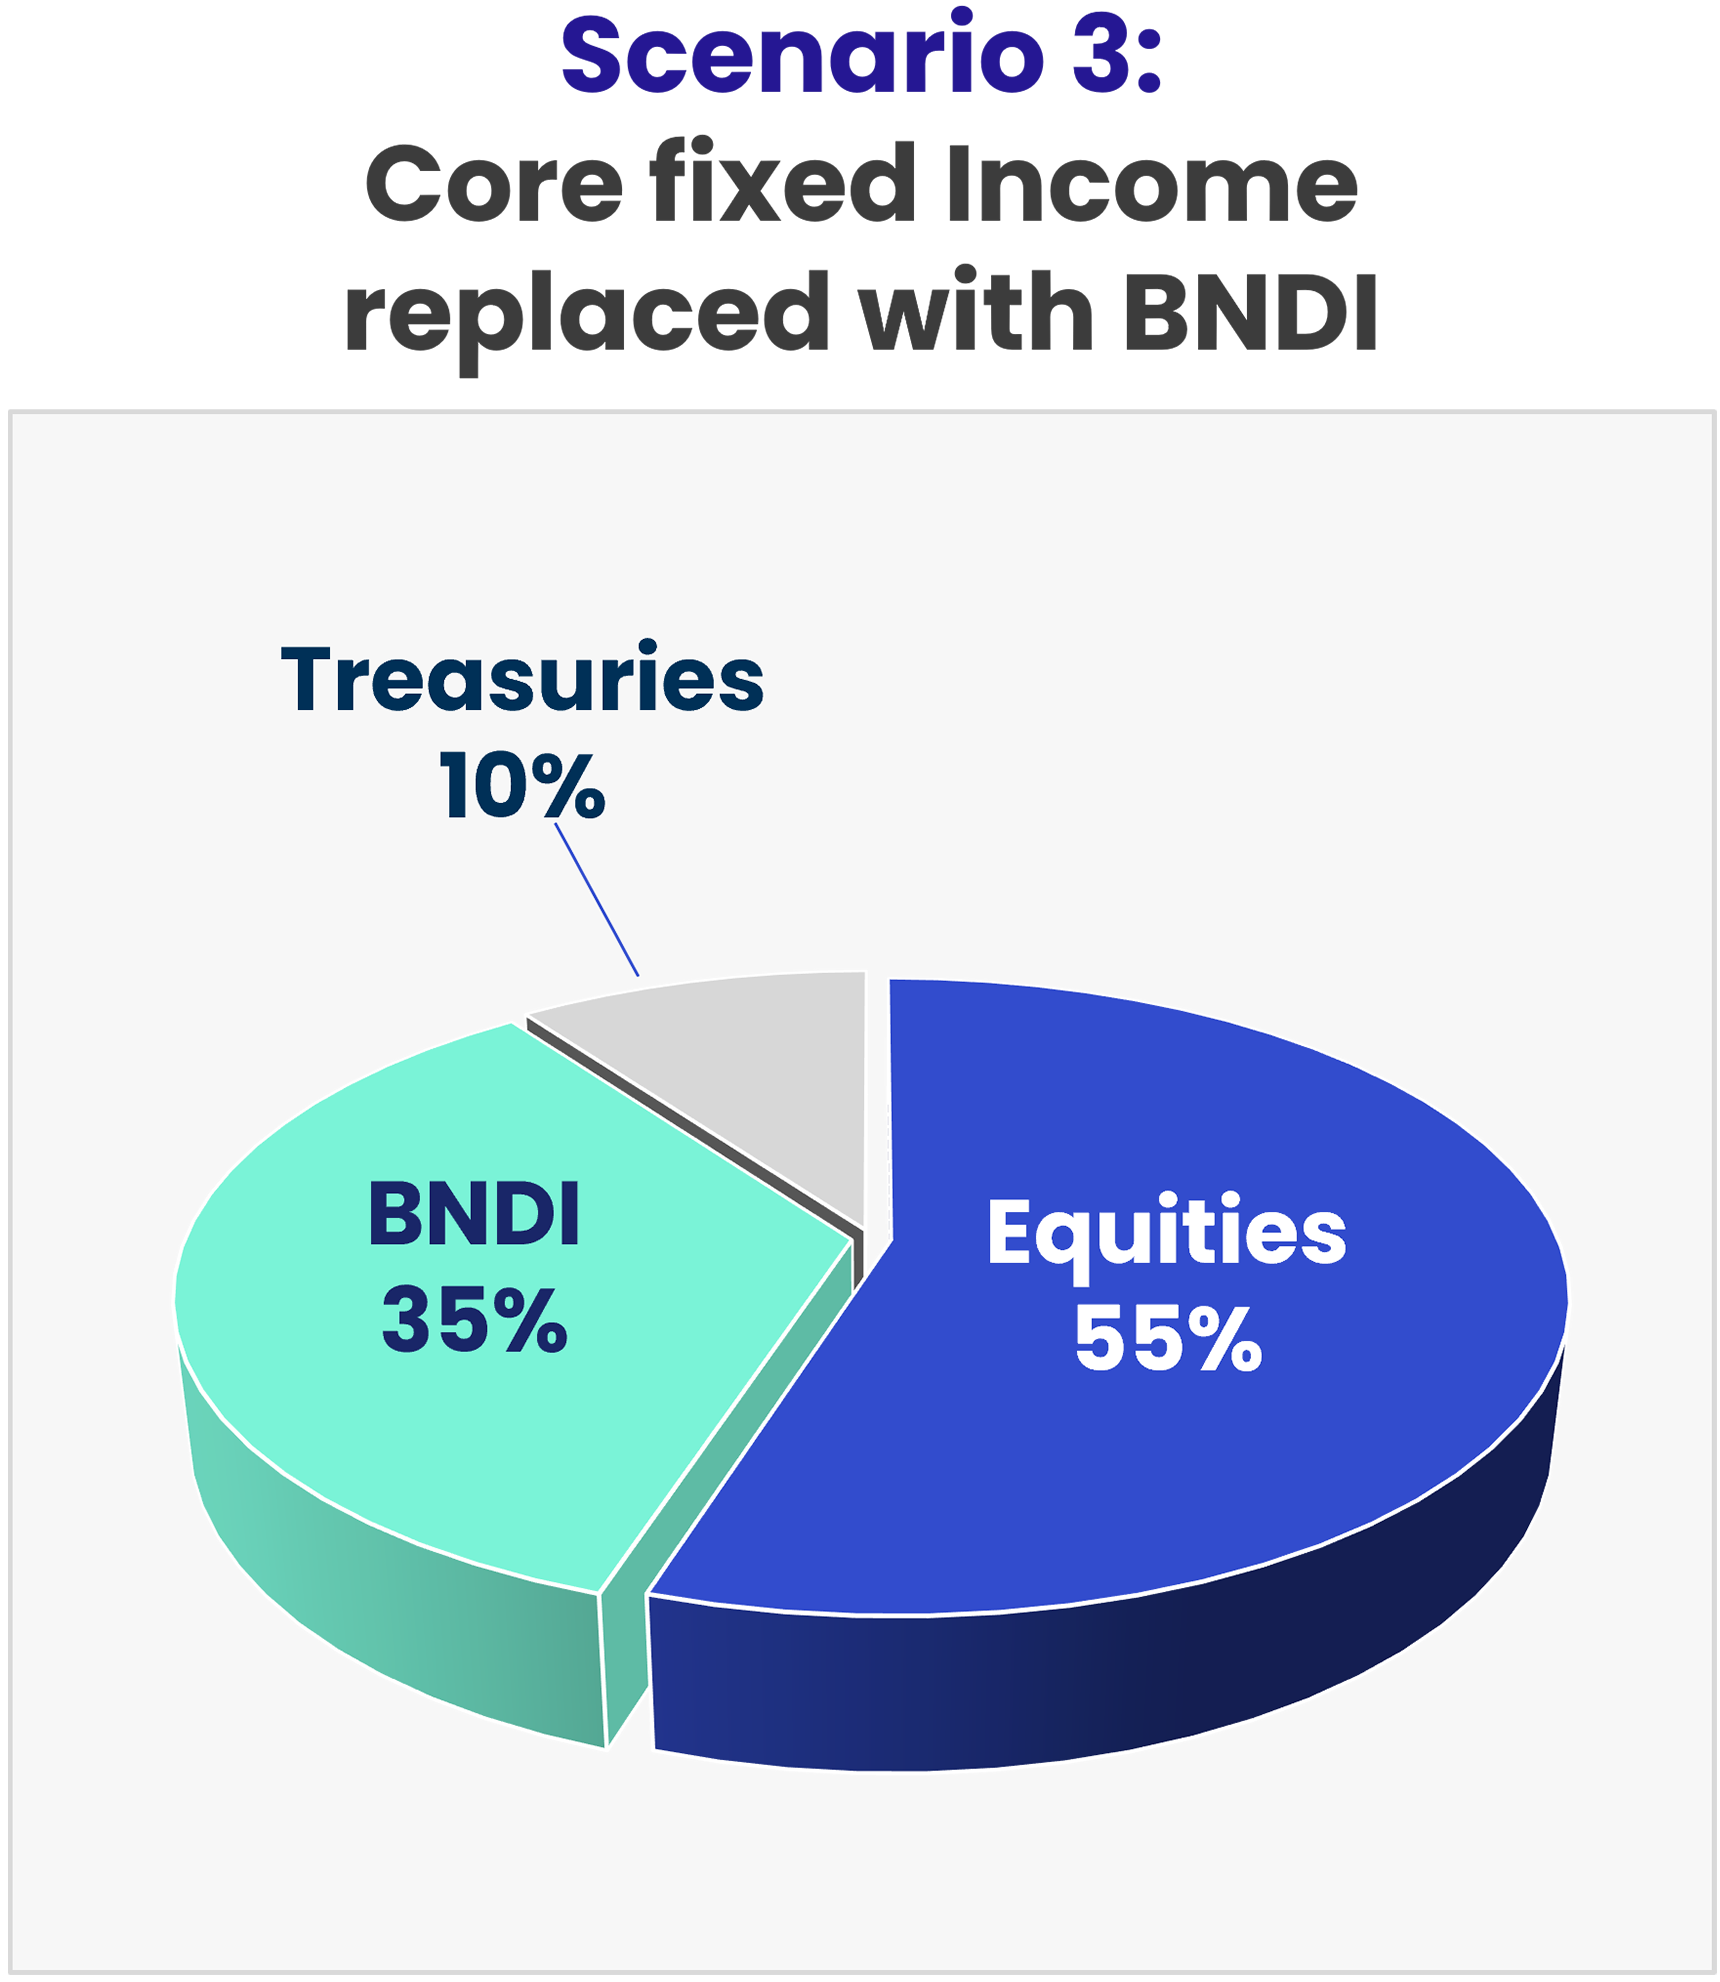
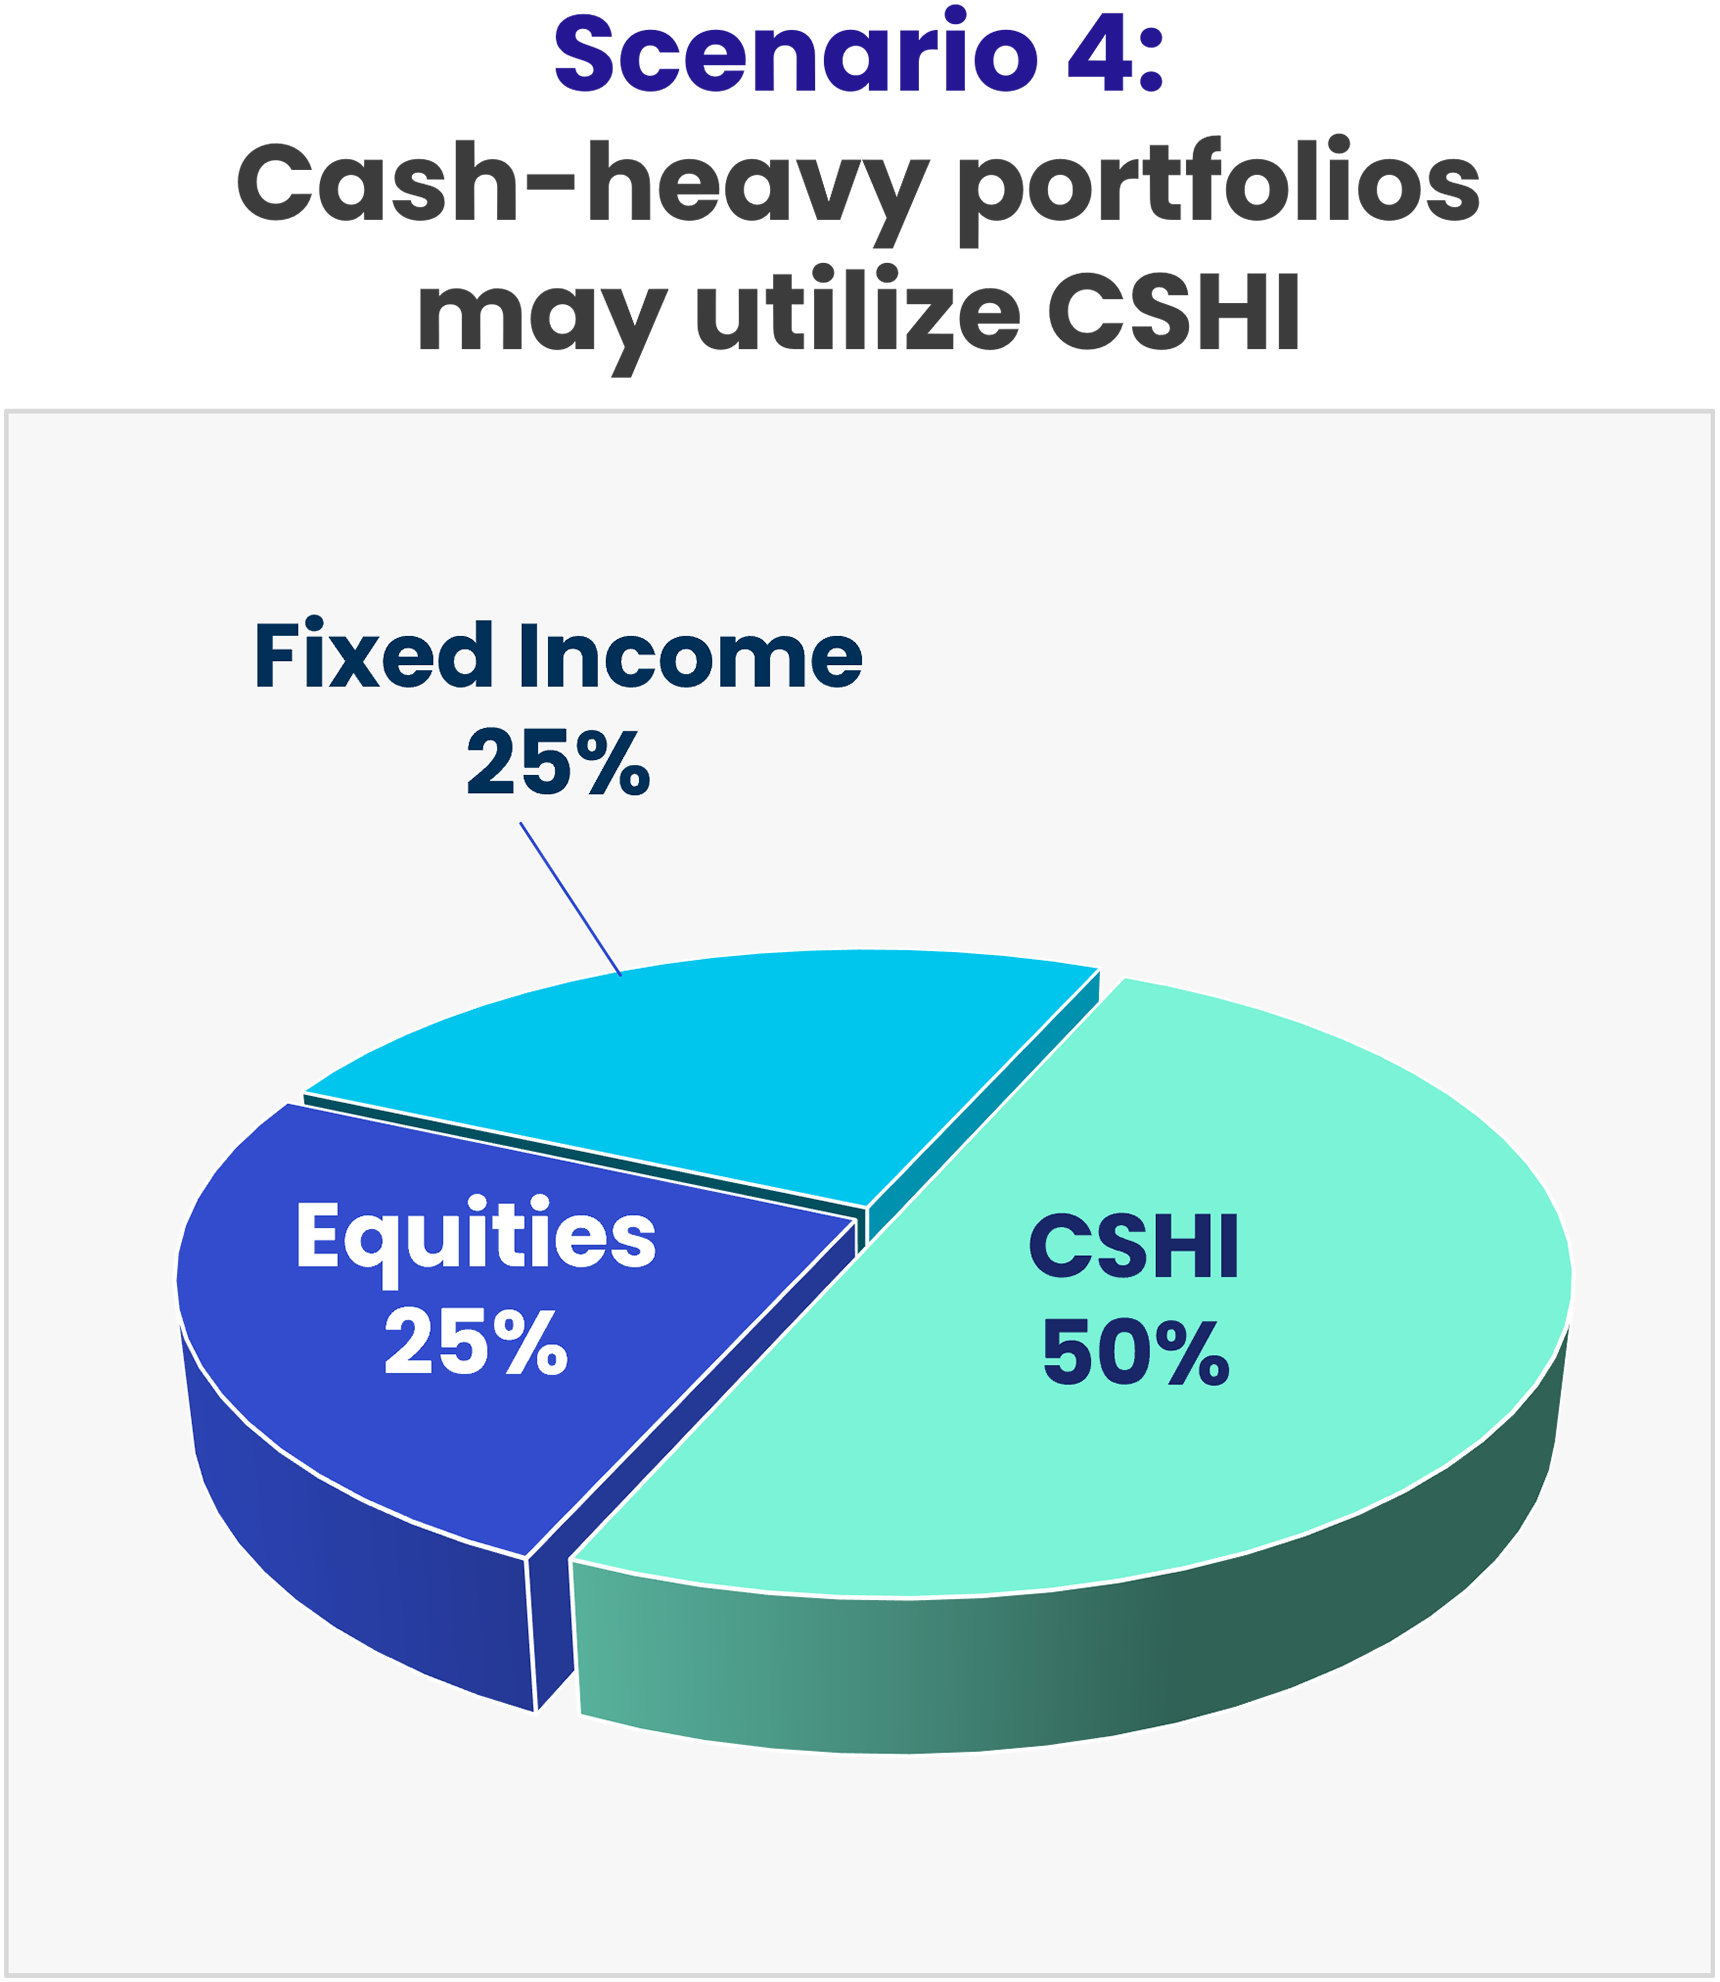
NEOS ETFs May Offer a Complement or Alternative to Existing Core Portfolio Allocations
As of 3/31/2024

| Portfolio Yield |
1 Yr Standard Deviation |
|---|---|
| 2.48% | 10.01% |

| Portfolio Yield |
1 Yr Standard Deviation |
|---|---|
| 8.40% | 7.16% |

| Portfolio Yield |
1 Yr Standard Deviation |
|---|---|
| 3.07% | 10.03% |

| Portfolio Yield |
1 Yr Standard Deviation |
|---|---|
| 4.23% | 5.28% |
Treasuries = SPDR Bloomberg 1-3 Month T-Bill ETF (BIL) | Fixed Income = iShares Core U.S. Aggregate Bond ETF (AGG) | Equities = SPDR S&P 500 ETF Trust (SPY)
Past performance does not guarantee future results. The hypothetical scenarios are for illustrative purposes only. For each NEOS ETF's regulatory documents, standardized performance, and additional information, please click on the corresponding ticker: SPYI | BNDI | CSHI.
30-Day SEC Yield: SPYI = 0.78% | BNDI = 2.74% | CSHI = 4.88%
Short term performance, in particular, is not a good indication of the fund’s future performance, and an investment should not be made solely on returns. Please see disclosures at the bottom of the page for a comparitive ETF discussion. Source: Morningstar.